Beverages M&A: Why Soft Drinks Are Outpacing Alcohol on Deals And Valuation (Q2 2026)
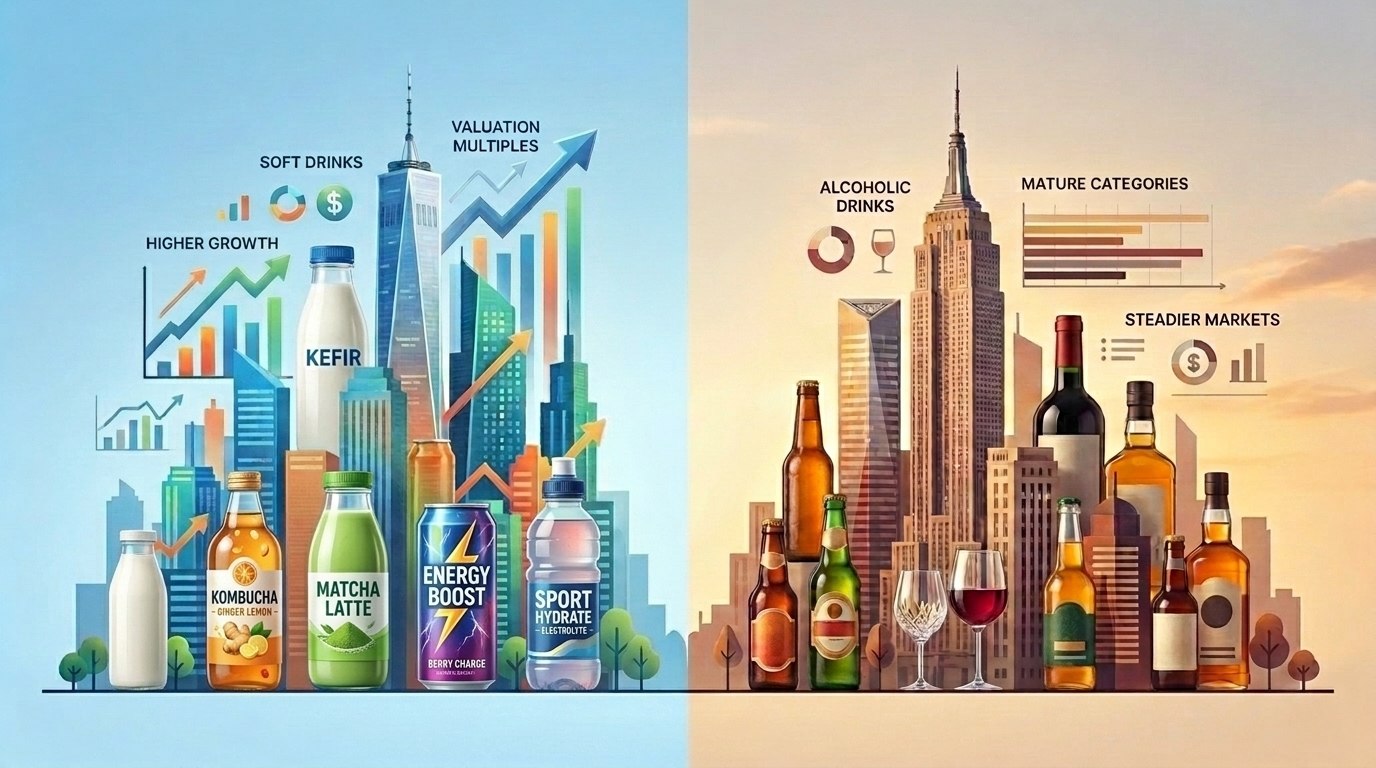
Soft drinks are outgunning alcohol on valuation, and the deals cutting across both categories are reshaping the landscape. The interesting question is what the public market data says about what drives the premium: growth, margin quality, scale, geography, and often a combination of all four.
From One Beverage Bucket to a Split Market
A decade ago, it was tempting to treat beverage companies as one broad defensive consumer category. Today, markets are much more selective: alcoholic portfolios are typically valued as cash-generative but mature, while soft drinks and functional beverages with credible health, energy or wellness positioning are increasingly treated as growth assets.
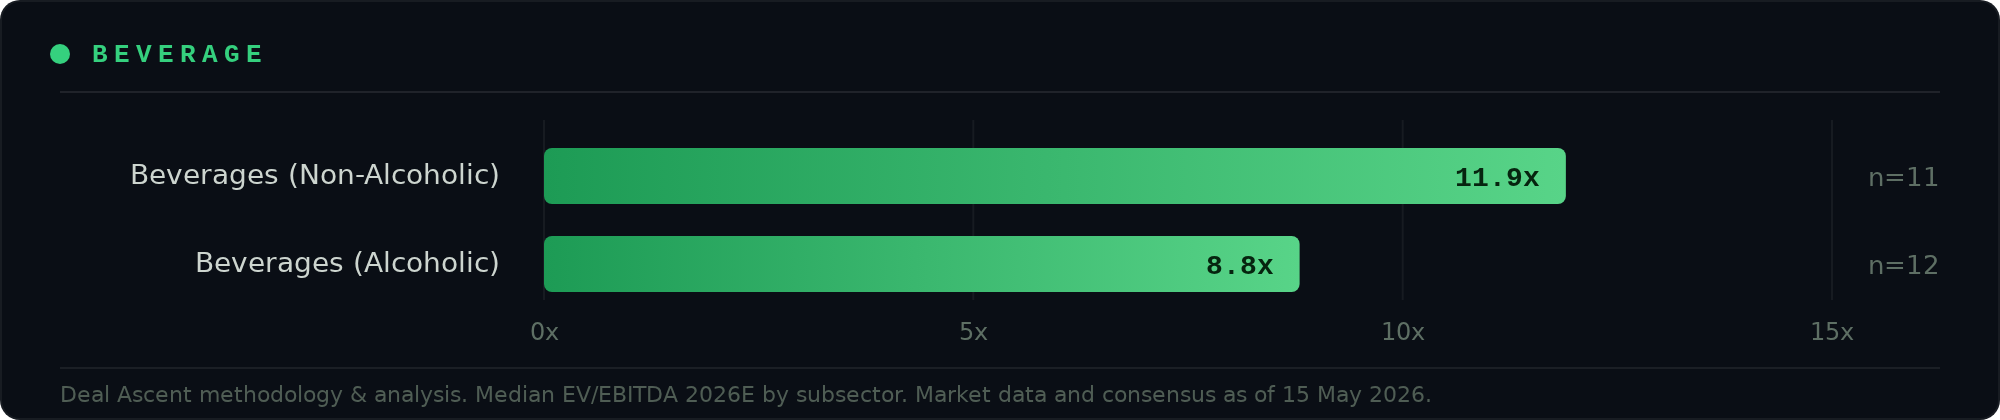
Beverage Trading Comparables EV/2026E EBITDA
That split is visible in the listed comp set. The alcohol group trades at a median of 8.8x EV/EBITDA 2026E versus about 11.9x for soft drinks, even though average EBITDA margins are not dramatically different across the two baskets. The market is not paying the premium for better profitability; it is paying for category momentum, perceived runway, and the strategic value of owning faster-growing consumer occasions.
What the Numbers Say About the Multiple Gap
Growth does more work than margin in explaining the valuation spread. In alcohol, high-margin businesses do not always command the highest multiples: Constellation Brands has one of the strongest EBITDA margins in the set at 37% yet trades at 11.2x, while Rémy Cointreau sits at 13.8x with margins of 23%. Investors are rewarding portfolio quality, premiumisation and brand mix, not simply absolute margin level.
The soft drinks basket makes the point even more clearly. Monster and Vita Coco both trade at around 28x EV/EBITDA, supported by double-digit forecast revenue growth, despite EBITDA margins of 31% and 19% respectively. By contrast, Coca-Cola trades at 21.4x with a sector-leading 35% margin but only 3% forecast revenue growth, while PepsiCo sits at 11.9x with 20% margin and 4% growth. The market is therefore paying up most aggressively where growth and growth quality are visible, then using margins as a credibility check rather than the sole driver of value.
Beverages — Alcoholic — Listed peers ranked by EV/EBITDA (2026E). Figures in millions of local currency.
| Company | Country | Mkt Cap (m, local ccy) | EV/EBITDA 2026E | EBITDA Margin 2026E | Rev Growth avg 26-28E |
|---|---|---|---|---|---|
| Rémy Cointreau SA | France | 2,237 | 13.8 | 22.6% | 1.2% |
| Constellation Brands | US | 31,714 | 11.2 | 36.8% | -3.0% |
| Davide Campari-Milano N.V. | Netherlands | 6,649 | 10.9 | 25.0% | 3.2% |
| Diageo PLC | UK | 55,656 | 10.1 | 32.5% | -0.4% |
| Anheuser-Busch InBev | Belgium | 125,866 | 9.1 | 36.1% | 5.4% |
| Pernod Ricard | France | 15,629 | 9.0 | 30.1% | -3.5% |
| Carlsberg A/S | Denmark | 113,844 | 8.6 | 21.4% | 3.8% |
| Royal Unibrew A/S | Denmark | 28,151 | 8.2 | 19.7% | 2.6% |
| Heineken NV | Netherlands | 38,598 | 7.6 | 22.6% | -0.9% |
| C&C Group plc | UK | 667 | 7.2 | 6.6% | -3.8% |
| The Boston Beer Company Inc | US | 2,055 | 6.7 | 11.4% | 0.6% |
| MGP Ingredients Inc. | US | 518 | 3.9 | 18.7% | 0.5% |
| Median | 8.8 | 22.6% | 0.6% |
Beverages — Soft Drinks — Listed peers ranked by EV/EBITDA (2026E). Figures in millions of local currency.
| Company | Country | Mkt Cap (m, local ccy) | EV/EBITDA 2026E | EBITDA Margin 2026E | Rev Growth avg 26-28E |
|---|---|---|---|---|---|
| The Vita Coco Company, Inc. | US | 3,019 | 28.3 | 19.1% | 15.2% |
| Monster Beverage | US | 74,908 | 27.9 | 31.1% | 11.0% |
| The Coca-Cola Company | US | 300,725 | 21.4 | 35.2% | 2.9% |
| Fever-Tree Drinks | UK | 947 | 15.5 | 12.5% | 7.0% |
| National Beverage Corp. | US | 4,034 | 12.0 | 21.8% | 0.7% |
| PepsiCo Inc. | US | 196,596 | 11.9 | 19.7% | 4.0% |
| Keurig Dr Pepper Inc | US | 38,054 | 11.0 | 24.2% | 24.9% |
| Celsius Holdings, Inc. | US | 11,791 | 9.0 | 23.3% | 16.7% |
| A.G. BARR p.l.c. | UK | 679 | 8.8 | 17.4% | 6.7% |
| Primo Brands Corporation | US | 5,978 | 8.8 | 21.7% | 3.0% |
| Nichols plc | UK | 349 | 7.7 | 19.7% | 3.8% |
| Median | 11.9 | 21.7% | 6.7% |
Source: company filings / consensus estimates. Shaded cells are at or above the peer-set median.
Scale Helps, But It Does Not Set the Ceiling
Size matters in beverages, but it is providing a floor more than a ceiling. In alcohol, the global giants such as AB InBev, Diageo, Carlsberg and Heineken mostly cluster in the high-single to low-double-digit multiple range, reflecting scale, route-to-market strength and cash generation, but also the reality that many of their core categories are mature. Mid-market and smaller names can outperform that range where they offer a cleaner premium story, but sub-scale businesses with weaker growth or poor margins are punished hard: C&C trades at 7.2x, Boston Beer at 6.7x and MGP at 3.9x.
Soft drinks show an even clearer pattern. Large-scale incumbents such as Coca-Cola and PepsiCo are well supported, but they do not command the highest multiples in the set. Instead, the ceiling is set by businesses with more obvious growth narratives, such as Monster and Vita Coco, while smaller UK names such as Nichols and A.G. Barr remain in the high-single-digit range despite respectable profitability.
Geography Matters, But Category Matters More
Geography still influences valuation through investor base, liquidity and market appetite. In alcohol, the French premium spirits houses sit at the top end of the range, while European brewers mostly trade lower, reflecting the market's preference for premium spirits exposure over mature mainstream beer portfolios.
In soft drinks, the highest multiples sit overwhelmingly with US-listed names, especially those exposed to energy, functional or wellness-led demand. UK-listed soft drink names such as Fever-Tree, A.G. Barr and Nichols trade materially lower, despite decent margins and acceptable growth, which points to a combination of smaller scale, lower liquidity and a less aggressive valuation environment than the US market.
Beverage Deal Activity is Following the Valuation Logic
The strategic M&A market is already moving in line with these valuation signals. Beverage M&A activity was lower in 2025 on a headline basis, but strategic buyers remained active and category lines continued to blur. PepsiCo completed its $2 billion acquisition of Poppi to deepen its exposure to prebiotic soda and better-for-you refreshment, while Carlsberg completed its £3.3 billion acquisition of Britvic (13.6x EV/LTM EBITDA, or 10.2x including £100m of expected annual cost synergies) to broaden its beverage platform beyond beer.
Beverage Sector M&A — Recent Precedents
| Date | Target | Acquirer | Subsector | Deal Value | EV/EBITDA |
|---|---|---|---|---|---|
| May 2026 | Averna & Zedda Piras | Illva Saronno | Alcohol — Italian amari & liqueurs | €100 | 8.3x |
| Apr 2026 | JDE Peet's | Keurig Dr Pepper | Soft drinks — coffee & tea | $23,000 | 12.9x |
| Dec 2025 | East African Breweries (EABL) | Asahi Group Holdings | Alcohol — beer & spirits (East Africa) | $3,807 | 15.3x |
| Oct 2025 | Coca-Cola Beverages Africa | Coca-Cola HBC | Soft drinks — soft-drink bottling (Africa) | $4,463 | ~9.9x |
| Sep 2025 | Florida Ice & Farm Co. (FIFCO) | Heineken | Alcohol — beer, soft drinks & food (Costa Rica) | $3,200 | 11.6x |
| Apr 2025 | Biotiful Gut Health | Müller | Soft drinks — kefir & gut-health drinks | £115 | 23.9x |
| Feb 2025 | Alani Nutrition (Alani Nu) | Celsius Holdings | Soft drinks — energy & functional drinks | $1,900 | 13.8x |
| Jan 2025 | Britvic | Carlsberg | Soft drinks — UK soft drinks & mixers | £3,300 | 13.6x |
| Oct 2024 | Ghost Energy | Keurig Dr Pepper | Soft drinks — energy drinks | $1,650 | 16.1x |
| Aug 2024 | Vitamin Well | Cinven | Soft drinks — health & wellness drinks | €3,000 | 20.0x |
| Dec 2023 | DAOU Vineyards | Treasury Wine Estates | Alcohol — Californian luxury wine | $900 | 12.8x |
Much of the alcohol activity is focused on portfolio reshaping, premium niches and selective growth adjacencies rather than broad-based consolidation. Buyers are willing to pay, but only where the target brings something incremental, whether that is premium positioning, route-to-market leverage, or relevance to faster-growing occasions such as RTDs, no- and low-alcohol, or adjacent soft drink channels.
Free business valuation & exit readiness assessment
Whether you are considering an exit in the near term or simply want to understand what your business could be worth and how to prepare, we are happy to start with a confidential, no-obligation discussion.
This article is intended for information purposes only and does not constitute financial, tax or legal advice. Valuation multiples are based on listed peer group consensus estimates as of Q2 2026 and are provided for directional context only. Private company transactions will differ. Specific professional advice should be sought before making any business or financial decisions.